The Importance of Scale in Geoscience
Scale is a fundamental concept in any discipline concerned with spatial patterns and processes, particularly in 3D seismic data interpretation for oil and gas exploration. Scaling is, in a way, another dimension — one that is designed for interpreting the patterns and processes of phenomena, thereby allowing viewers to better understand the mechanisms driving decision-making and perform data analysis in the oil and gas industries. In Earth sciences, a proper regard for spatial and temporal scales is essential to understanding the data being considered.
In geoscience, macro and micro elements translate to regional and prospect, well resolution or thin section resolutions, respectively. Scaling here refers to the literal size of a process, phenomenon, or measurement and the way in which that process, phenomenon, or measurement relates to the spatial and/or temporal extent of a specific investigation, as well as the typical spatial resolution corresponding to its size. Because geoscientists collect and analyze several distinct types of data that vary in size and frequency, the varying scale of numerous data must be considered.
In 3D seismic data interpretation and asset development especially, the view and interpretation of the scale of varied data have a profound effect on the result, thereby affecting decision-making in oil and gas exploration.
In consequence, data viewers can end up reinforcing bias, either by missing the enormity of an operation or getting bogged down in details and failing to grasp the big picture of a particular circumstance. This can significantly limit the usefulness of seismic data for oil and gas exploration.
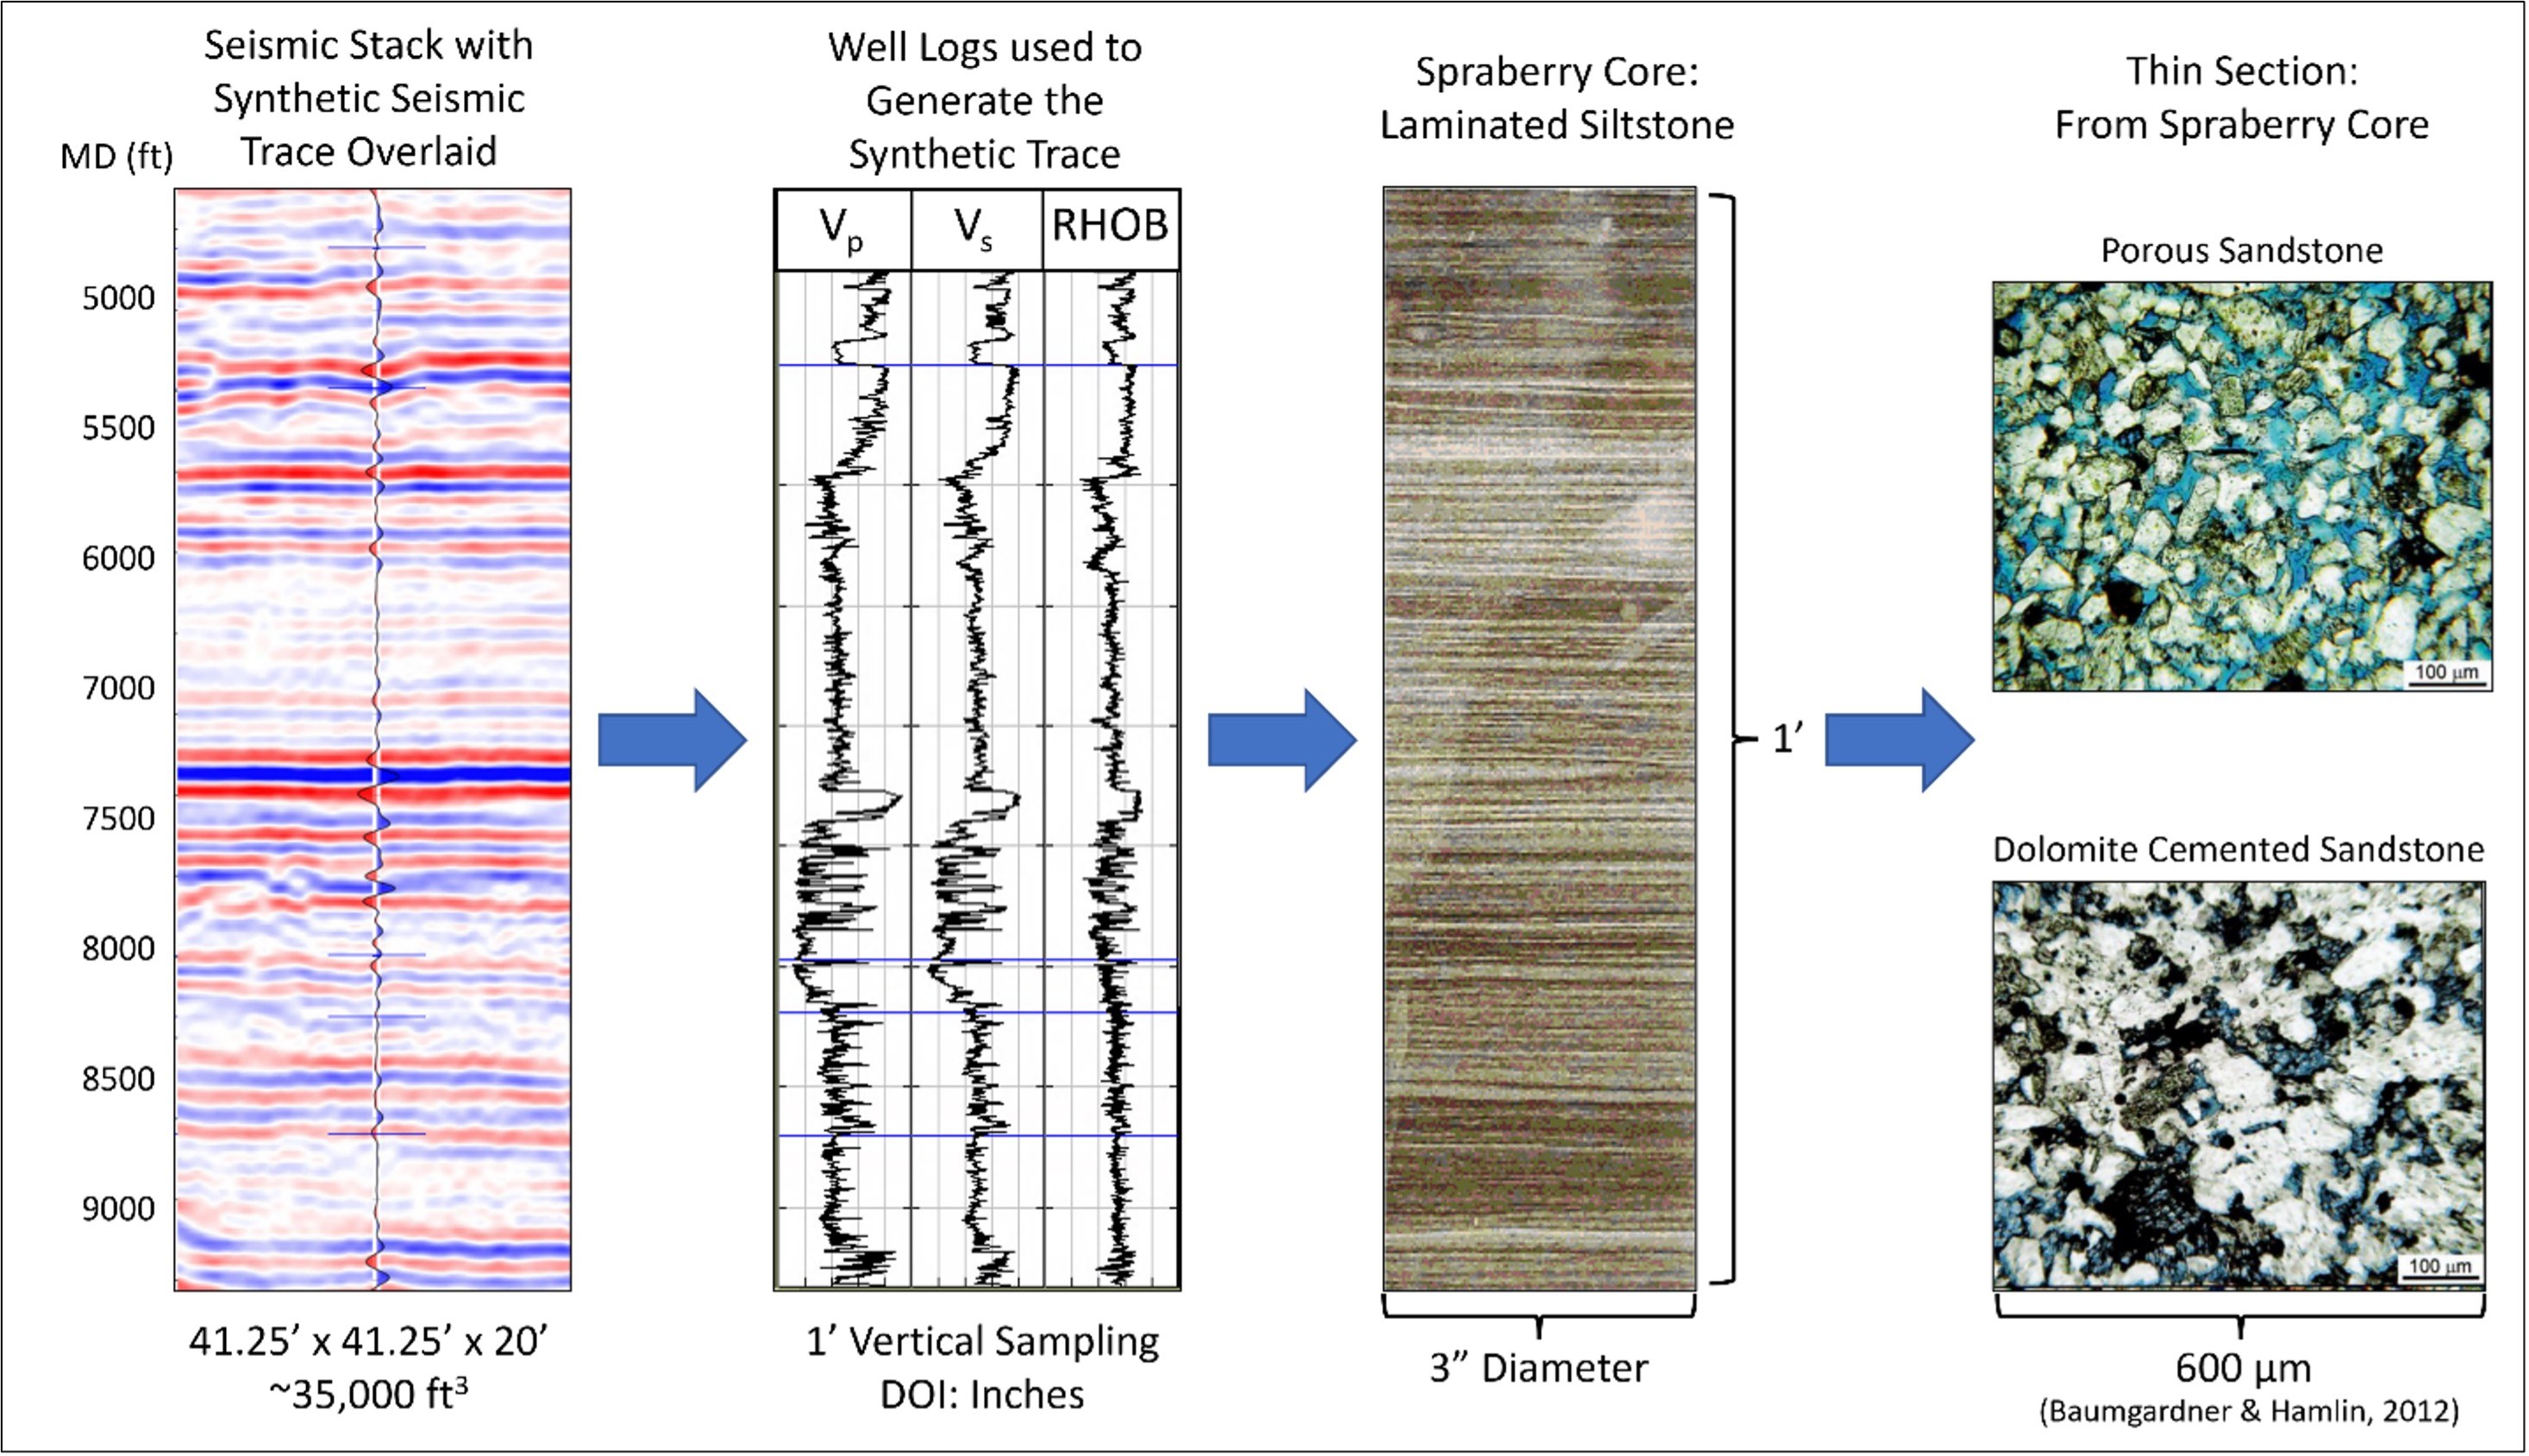
This graph illustrates the context of varying scale in geoscientific applications and engineering. The datasets here range from measurements of tens of thousands of feet to those of micrometers. The seismic stack shown on the far left operates on the largest scale, a scale which necessitates an averaging over of certain types and scales of data — in this case, vertical variation.
The well log to its right, however, is able to show this variation because it operates on a smaller scale. This trend, of course, continues downline. The core (Spraberry), in turn, shows laminated strata that are averaged over by the well log, and the thin section is able to provide details within each of these strata that can only be seen at this fine scale.
Each visualization has, in a way, its own unique language that needs to be recognized and considered simultaneously in order to put each in proper context. Keeping such scales in mind in an interdisciplinary fashion when interrogating data, then, is essential to understanding seismic data interpretation and the integration of data in other areas of study along the value chain.
Post Date
May 30, 2023Post Category
Technical Papers
Author
Brian Adams