Harnessing the Barnett Shale Potential in Ector County, Texas

A Case Study on the Emergence of the Barnett Shale in the Midland Basin, Ector County, Texas
Andrew Lewis*1, Taylor Mackay1, Robert Dimit 2, Brett Bracken2, Andrew Bell 3
1. Fairfield Geotechnologies, 2. Ares Energy, 3. Andrew D. Bell Exploration, Inc.
Copyright 2024, Unconventional Resources Technology Conference (URTeC) DOI 10.15530/urtec-2024-4055274
This paper was prepared for presentation at the Unconventional Resources Technology Conference held in Houston, Texas, USA, 17-19 June 2024.
The URTeC Technical Program Committee accepted this presentation on the basis of information contained in an abstract submitted by the author(s). The contents of this paper have not been reviewed by URTeC and URTeC does not warrant the accuracy, reliability, or timeliness of any information herein. All information is the responsibility of, and, is subject to corrections by the author(s). Any person or entity that relies on any information obtained from this paper does so at their own risk. The information herein does not necessarily reflect any position of URTeC. Any reproduction, distribution, or storage of any part of this paper by anyone other than the author without the written consent of URTeC is prohibited.
Abstract
This case study looks back on a five oil and gas well drilling program by Ares Energy targeting the Lower Barnett Shale in Ector County, Texas. Each of the five wells in this Barnett Shale drilling program benefitted from the use of high trace density (HTD) 3D seismic data. With very few corollary wells in proximity, the HTD 3D seismic data was used to characterize the target geology to properly position each of these wells and plan the development of Ares’s acreage. This study looks back at each of these wells using a Kirchhoff pre-stack depth migration (KPSDM) image that utilized a high-resolution velocity model generated using full waveform inversion (FWI) to assess the quality of the landing and production.
Introduction
In Texas, the Barnett shale is thought of as a prolific natural gas bearing formation at the forefront of the shale revolution in the Fort Worth Basin. However, over the past five years, this formation has emerged as an economic new play in the Midland Basin with over 65% liquids (Blackmon, 2023). The Barnett fairway occurs along the transition zone from the Central Basin Platform into the Midland Basin.
Operators continue to push the extent of this fairway into the basin (McEwen, 2023). While the Barnett shale in the Midland Basin has significant gas associated with the oil production, the gas-to-oil ratios (GOR) are comparable to traditional Spraberry and Wolfcamp targets. The major difference between the Barnett and the Wolfcamp in the Midland Basin is the significant reduction in associated water. Thus, much of the water handling expenses have been considerably reduced by comparison. Consequently, the Barnett Shale favorably competes for capital with traditional Spraberry and Wolfcamp targets.
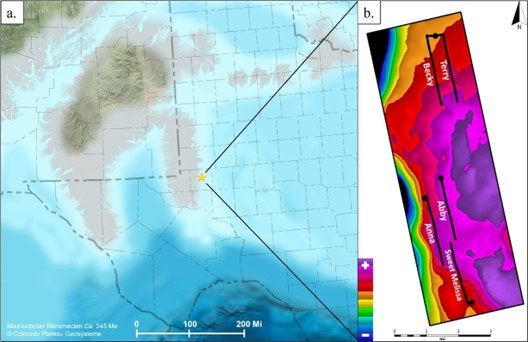
This study focuses on a five well drilling program between September 2021 and November 2023 in Ector County, Texas by Ares Energy (Figure 1). Each of the wells in this program are named after women related to Ares Energy employees. The Sweet Melissa was the first of the well drilling program and began flowing back in February of 2022. Based on initial production from this well, plans for an additional well began. Almost a year later, in January of 2023, a second well was drilled, the Anna, and began producing.
The Abby Unit was the third well, which began producing in August of 2023. Then in the northern portion of the study area, the fourth and fifth wells, the Becky and Terry were drilled, each from the same pad, spaced approximately half of a mile from each other and were simultaneously fracked. Both wells began flowing back in October of 2023. While the lateral lengths of each wellbore vary slightly from well to well, they are all essentially 2-mile laterals.
From its infancy, this Barnet shale oil and gas well drilling program has benefited from the use of HTD 3D seismic data collected in 2019. In new plays like the Barnett, high-quality seismic data is critical in the planning for proper well positioning in the target interval especially when there are not many corollary wells in proximity. Furthermore, 3D seismic is beneficial for overall project planning to optimize risk reduction as well as the placement and spacing of wells within a given acreage position.
Geologic Setting
During the early Paleozoic era, the current Greater Permian Basin was a broad marine basin commonly referred to as the Tobosa Basin. A significant accumulation of carbonates was deposited during the Ordovician, Silurian, and Devonian periods, until the initiation of slight uplifts and erosion in the late Devonian resulted in a major unconformity. Additional tectonic stresses intensified during the early to late Mississippian period, promoting continued uplifts and erosion in some areas while associated downwarping provided ample depositional settings for mixed sedimentation. With the Hercynian collisional orogeny of North America and Gondwana Land beginning in the late Mississippian, the Tobosa Basin was deformed along high angle basement-rooted faults and pre-existing zones of weakness into the Permian Basin as we know it today where the Delaware and Midland foreland basins are separated by the Central Basin Platform (Horak, 1985).
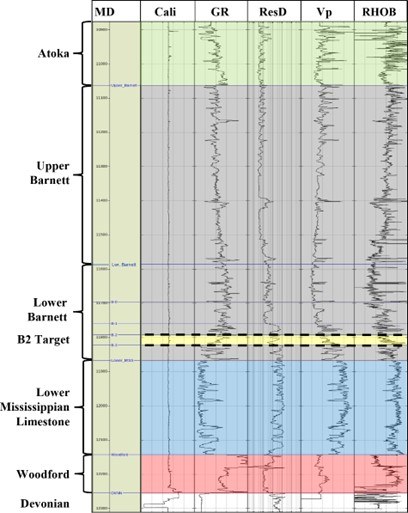
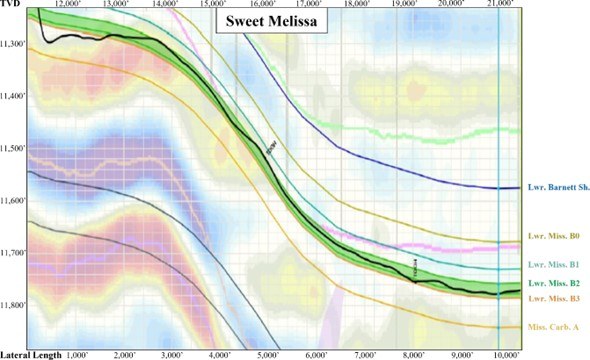
The stratigraphy of interest in the study area is related to the Mississippian subperiod, which is the earliest subperiod of the Carboniferous period, occurring from 323 – 359 million years ago. During this subperiod, sedimentation within the ancestral Tobosa Basin oscillated between deep-water deposition of shales to shallow-water deposition of carbonates and siliciclastics. The Woodford shale is the earliest formation of the Mississippian (beginning in the late Devonian) and is well known as an organic rich petroleum source rock over much of the Permian Basin (Comer, 1991). Overlying the Woodford, the Lower Mississippian Limestone consists of well-sorted coarse-grained crinoid grainstones resulting from deposition in shallow, warm tropical waters within the early-to-mid Mississippian (Ruppel and Kane, 2006). Subsequent subsidence during the mid Mississippian resulted in the deposition of the Lower Barnett Shale (up to ~280’ thick) consisting of fine-grained siliciclastic-rich mudrock and carbonate lenses interfingering with organic rich shales. The organic rich shales within the upper part of the Lower Barnett are considered to be an additional source of hydrocarbon generation within the target. The primary target zone for the lateral portion of the wellbore is identified as the B2 bench (~30’ thick) in the lower part of this Lower Barnett interval. Continued subsidence during the mid-late Mississippian resulted in the Upper Barnett (up to ~530’ thick) of predominantly shale with lower Total Organic Content (TOC) and less mudrock and carbonate lenses. With the late Mississippian to early Pennsylvanian tectonics stabilizing the study area in a shallow water platform, the Atoka section is primarily a transition to interfingering limestones consisting of algally dominated bioherms and ooid grainstones (Wright, 2006). The expression of these formations on wireline logs is shown in Figure 2 based on a vertical well located within the study area.
Data and Methods
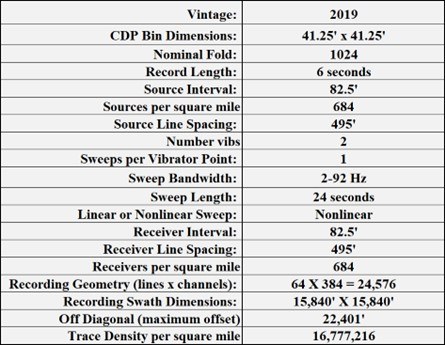
The 3D seismic data used in this study is a 27 square mile subset from a 2019 vintage HTD 3D seismic survey. Acquisition parameters associated with this survey include 495’ source and receiver line spacings with 82.5’ source and receiver station spacings. These data were acquired with full azimuth out to 15,840’ of offset. The nominal fold of these data is 1024 per 41.25’ x 41.25’ bin (Figure 3). These data were processed through a KPSDM that incorporated a velocity model produced using time-lag full waveform inversion (Bai et al., 2021). The HTD acquisition design of this survey benefits the final seismic image for several reasons (Lewis et al., 2021):
- Fine sampling of near offsets allows ground roll to be precisely removed
- Small bins with high fold and a broadband sweep benefit spatial resolution
- FWI convergence to a high-resolution velocity model is accelerated by broadband sourcing, ground roll removal, and overall dense source and receiver sampling from near to far offsets
- Migration uses the high-resolution velocity model to image finer-scale geologic features
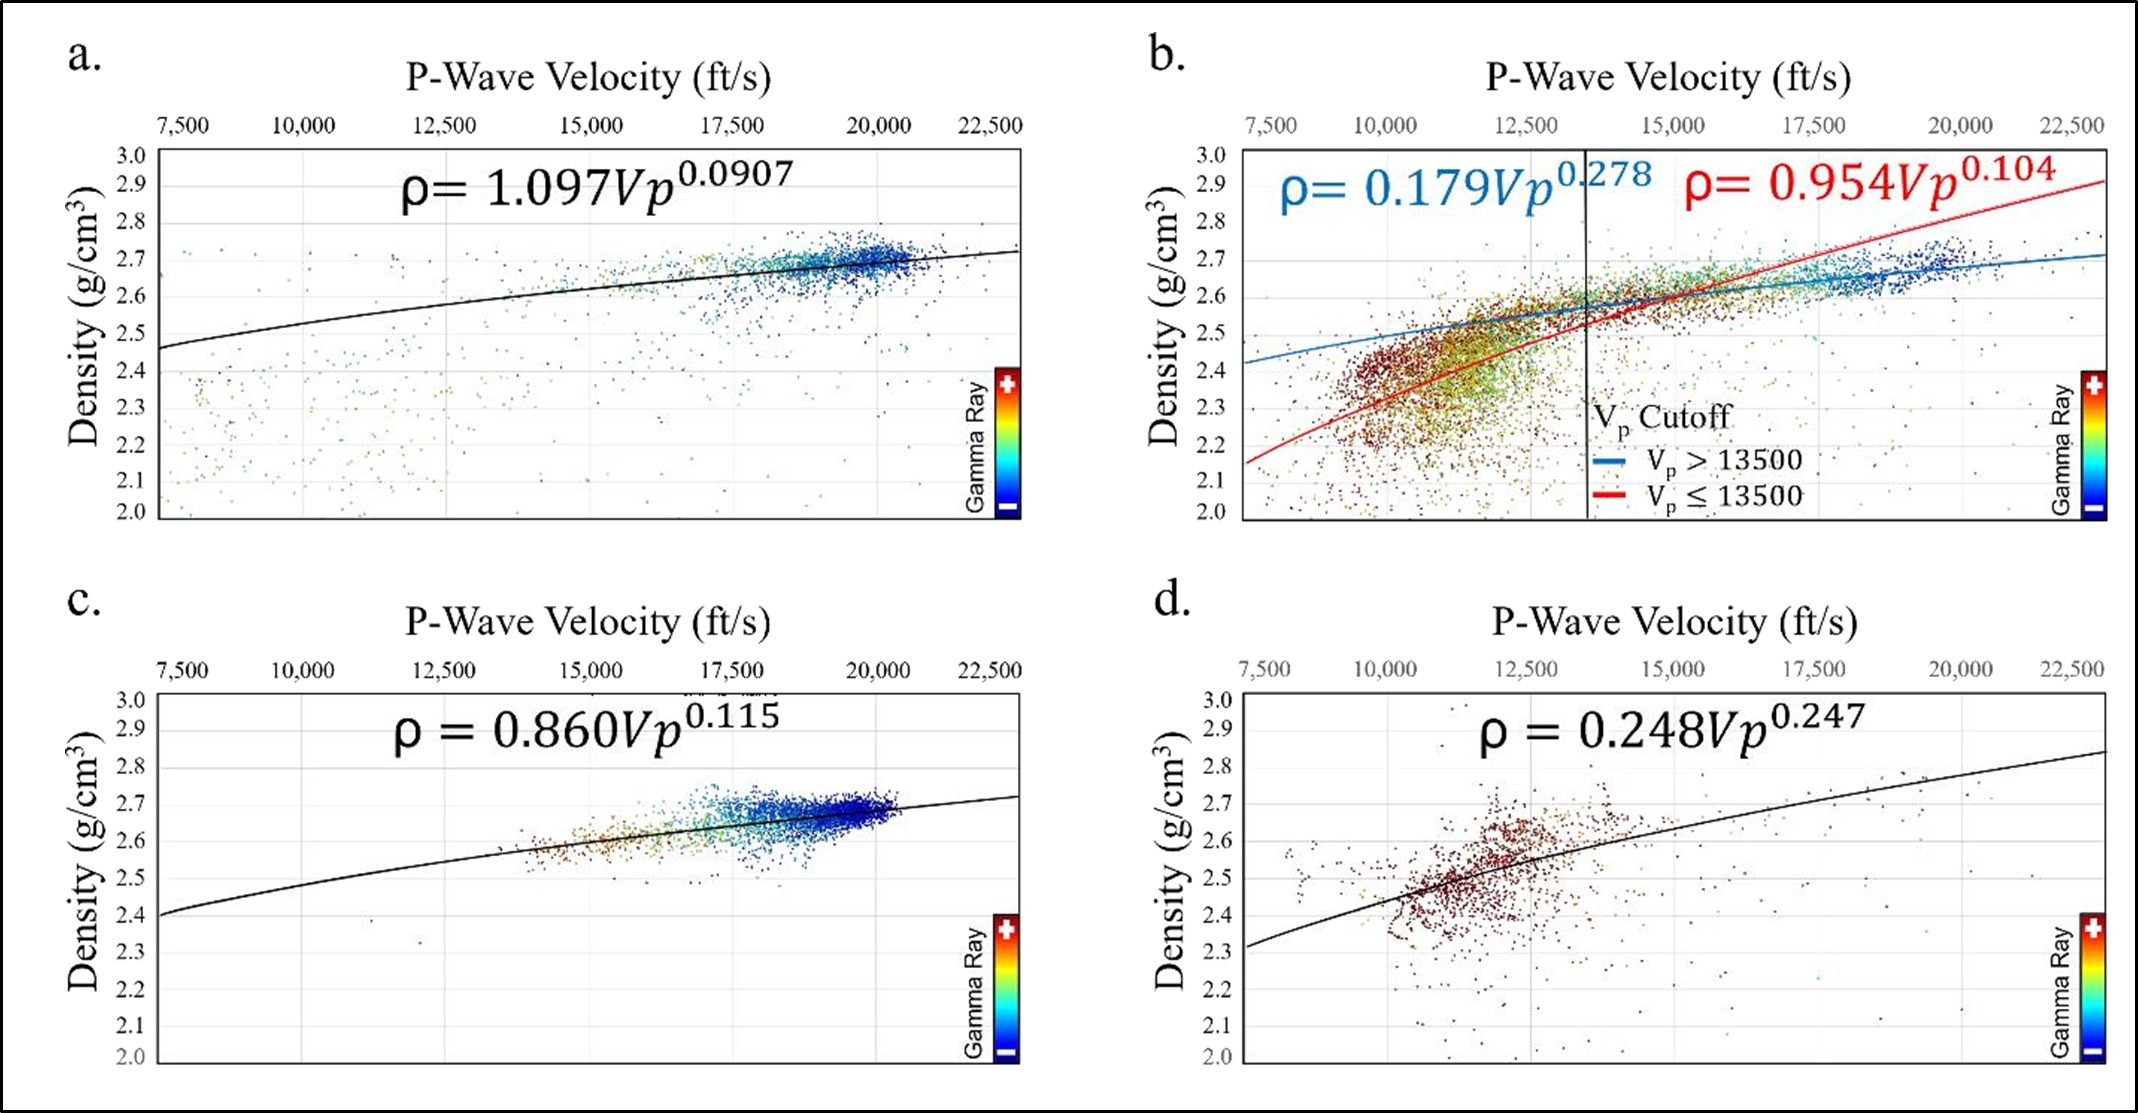
There is a dearth of sonic and density logs in the study area covering the target interval. Some basic rock physics relationships between P-wave velocity (Vp) and density (ρ) were created using sonic and density logs from an expanded search area along the Barnett fairway. These were developed separately for the Woodford, Lower Mississippian Limestone, Barnett (both Upper and Lower), and Atoka Lime formations (Figure 4). Horizons that separate these formations were interpreted on the KPSDM stack and used to calculate a pseudo-density model from the FWI velocity model. The FWI velocity model and pseudo- density model were multiplied together to produce an acoustic impedance background trend. This background trend is further filtered down to 0/0 – 4/8 Hz and used as the low frequency model in a post- stack simultaneous inversion. The acoustic impedance estimate output from the inversion shows an 85 percent cross correlation to the up-scaled acoustic impedance log response from the vertical well inside the study area (Figure 5).
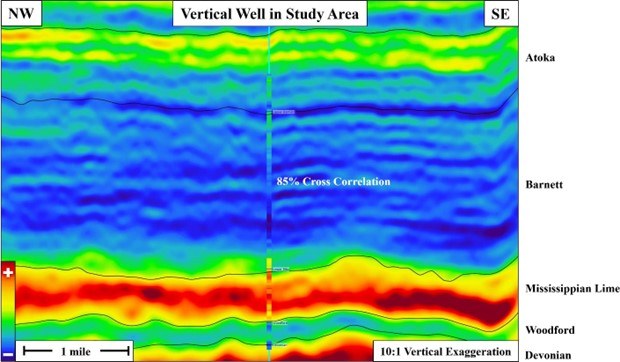
Gamma Ray Measurements While Drilling (MWD) and mud logs for each of the 5 wells were analyzed in this study. These were used to help determine how well the lateral portion of the wellbore stayed in the target B2 bench of the Lower Barnett Shale. The acoustic impedance estimate highlights the base of the Lower Barnett Shale and the top of the Lower Mississippian Limestone. The center of the B2 bench of the Lower Barnett is roughly 40 feet above the top of the Lower Mississippian Limestone in this area.
Results
Each of the five projects in this well drilling program are economically viable with expected ultimate recoveries (EUR) exceeding 1 million barrels of oil and 1.8 BCF of gas. The completions for each of the five wells are similar from well-to-well using a proppant intensity of 2,300 pounds per foot with proppant loading of one gallon per pound.
The Sweet Melissa has recovered over 270,000 barrels of oil and 495,000 MCF of gas in 23 months with an oil-cut of 85%. EUR for the Sweet Melissa is 1.2 million barrels of oil and 1.8 BCF. The second well, Anna has recovered over 187,000 barrels of oil and 340,000 MCF in 15 months with an oil-cut of 78% and an EUR of 1.2 million barrels of oil and 2.8 BCF. The Sweet Melissa paid-out in 8 months. However, the best well in this program is the third well, the Abby Unit. It has recovered over 185,000 barrels of oil and 340,000 MCF in 8 months and is expected to ultimately recover 1.4 million barrels of oil and 2.3 BCF.
Only two wells, the Sweet Melissa and the Anna, have been producing for over a year. However, the newer wells have similar production profiles to the Sweet Melissa and Anna. All five wells have initial 30-day peak rates exceeding 800 barrels of oil per day and are within 15% of each other. Well EURs are within 10% of each other. The latest wells in this program, the Terry and the Becky began production in October of 2023. They only had six months of production at the time this study was written. However, the initial production profiles of these wells look very similar to the Abby Unit.
The Sweet Melissa immediately benefited from the use of HTD 3D seismic data. In the planning stage, before seismic data was licensed, this well was planned to go through a very steeply dipping and potentially faulted zone in the middle of the lateral portion of the wellbore. Upon analysis of the HTD 3D seismic data, this well was repositioned about 850 ft to the west to mitigate the lateral’s traverse down the steeply dipping flank of an ancestral faulted structure. As a result, this well managed to be drilled longer than originally planned with a total lateral section of 10,155 ft. The first twelve months of production resulted in 220,155 BOE. The EUR for this well is 1,225,000 barrels of oil (125 BO/lateral foot) and 1.8 BCF of gas. The lateral wellbore tracks the Lower Barnett structure seen in the PSDM image to the degree that this well stayed within the 30 ft thick target window within the B2 bench despite encountering over 500 ft. of vertical drop midway through the lateral over a 1-mile distance (Figure 6).
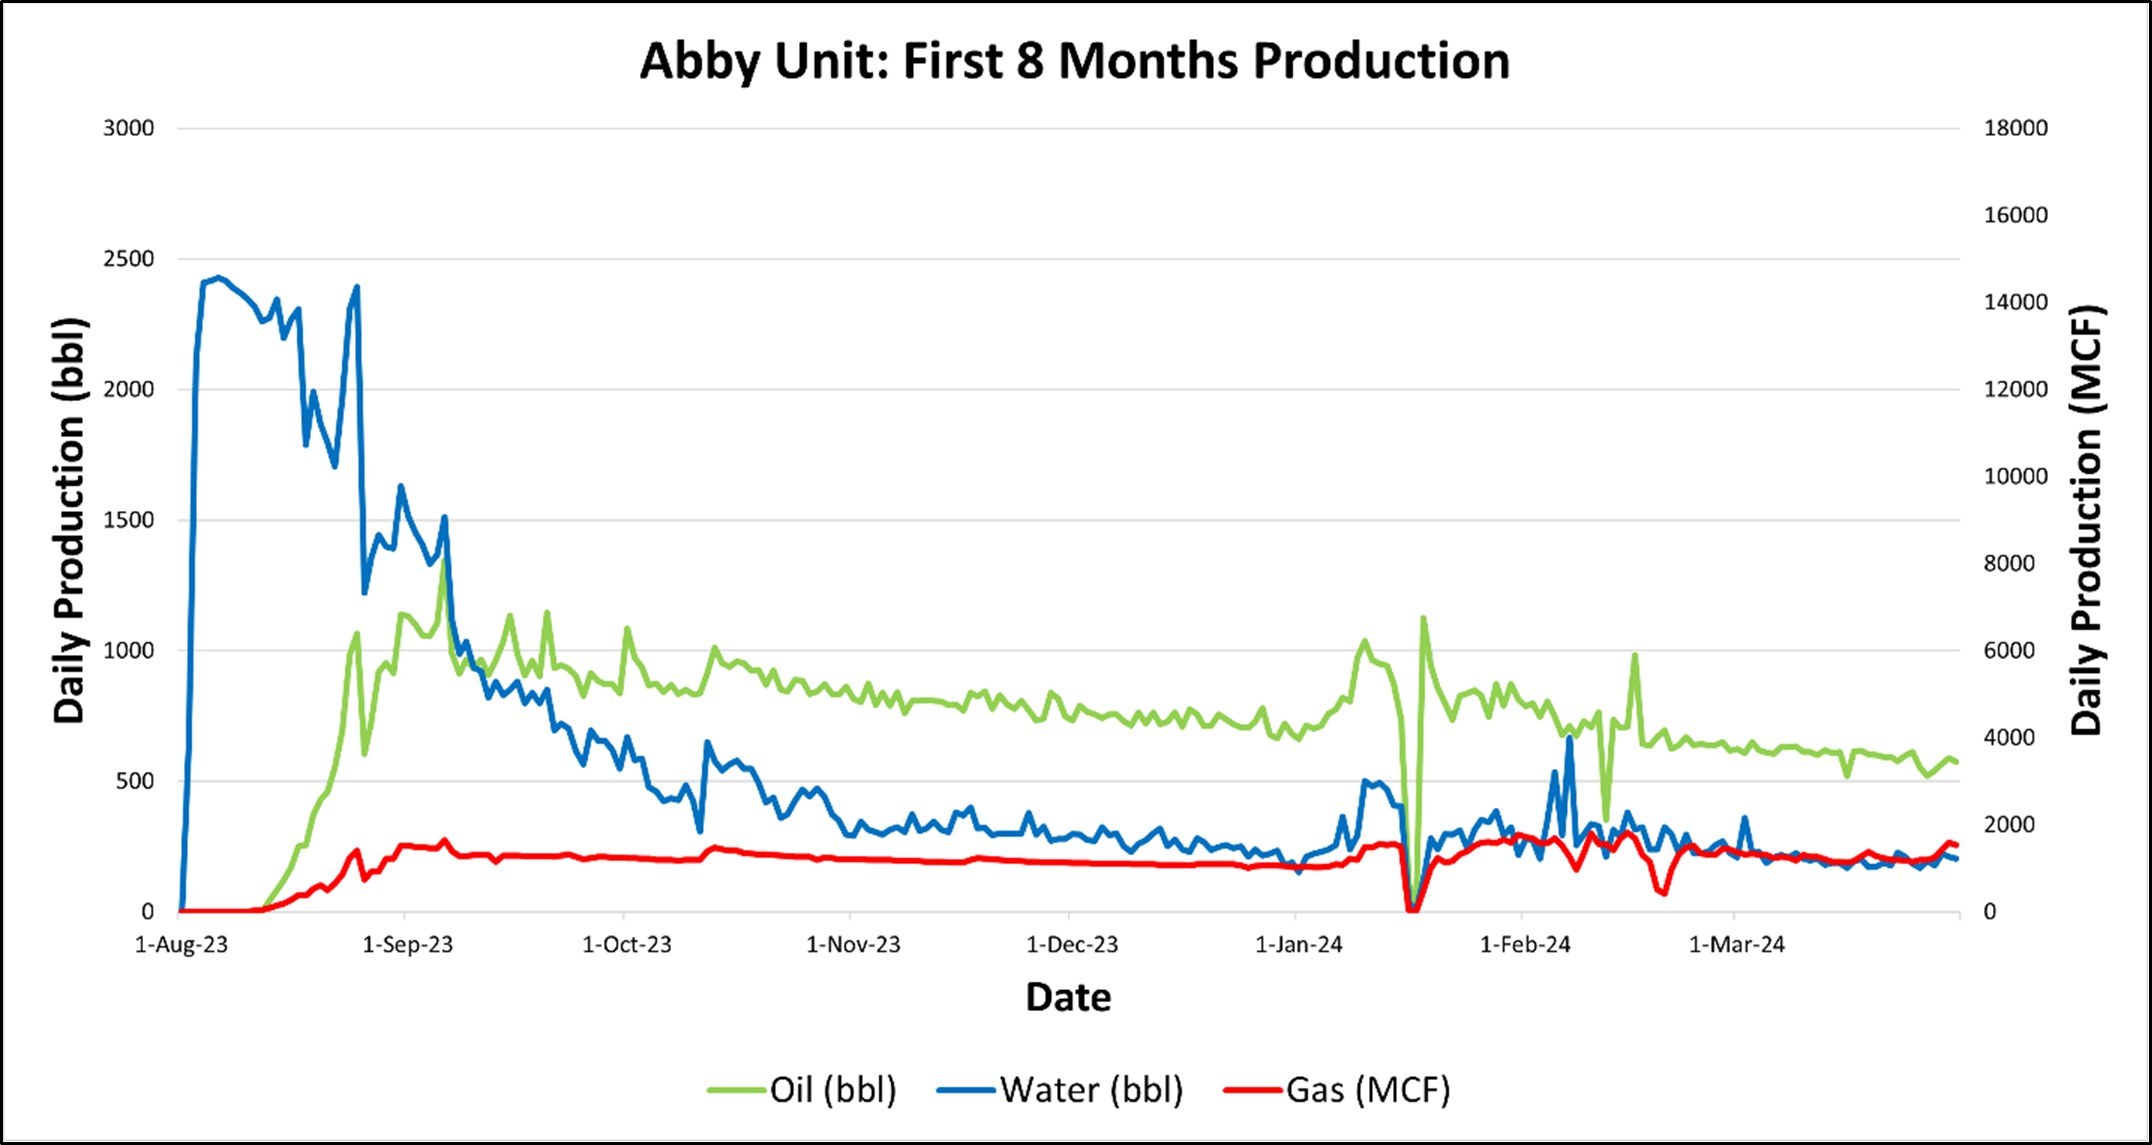
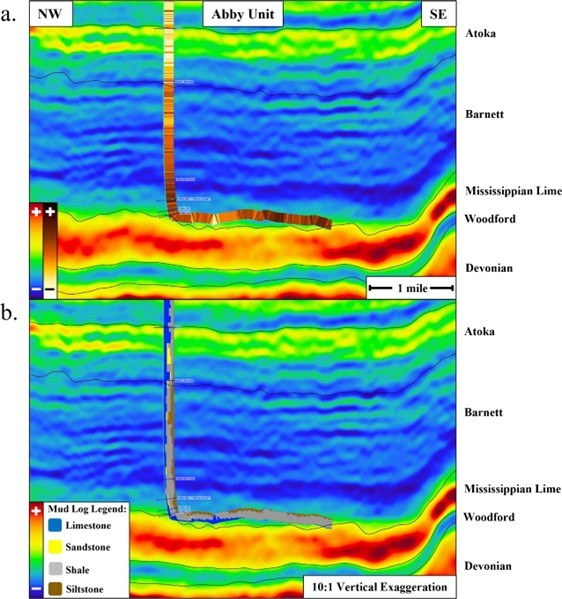
As previously mentioned, the Abby Unit is the best performing well out of the five wells analyzed in this study. By the end of March 2024, the Abby Unit had its first eight months of cumulative production equivalent to 224,585 BOE (Figure 7). The Abby Unit produced 57,400 BOE more than the Sweet Melissa produced during the same eight-month timeframe. This well was drilled in zone and stayed in zone for the vast majority of the lateral. It was the deepest of the five wells and the lateral portion of the wellbore was relatively flat compared to the other wells. As seen on the mud logs and MWD gamma ray, it only encountered significant limestone content, potentially from the B3 bench, for about 355 feet from 2,757’-3,112’ of the lateral portion of the wellbore (Figure 8).
The well drilling program exhibits high oil cuts almost immediately after completion. Only two thirds of the frac load is expected to be ultimately recovered in these wells. The Sweet Melissa is currently experiencing an 85% oil-cut on average. Similarly, after a short time The Anna and Abby Unit exhibited a 78% oil-cut after stimulation.
Conclusions
This case study illustrates the economic viability of the Lower Barnett Shale in Ector County, Texas and the importance of HTD 3D seismic data to unlock its potential. With so few corollary wells in proximity, high quality seismic data has greatly reduced the risk of drilling poor wells by optimizing well positioning and spacing throughout Ares Energy’s acreage position. While the cost of oilfield services and the price of WTI crude oil are variables that cannot be controlled, properly characterizing the geology in this area and steering wells within the target zone have led to five economically successful wells so far. A significant benefit of this emerging play is the high oil-cuts almost immediately after hydraulic fracturing operations have concluded. This significantly reduces the cost of waste-water disposal and the associated risk of induced seismicity and accelerated positive cash flow.
References
Ruppel, S. C., and Kane, J. 2006. The Mississippian Barnett Formation: A source-rock, seal and reservoir produced by early Carboniferous flooding of the Texas craton. Bureau of Economic Geology, University of Texas at Austin.
Bai, D., Zheng, L., and Deng, W. 2021. Imaging the complex geology in the Central Basin Platform with land FWI. SEG Technical Program Expanded Abstracts 2021: pp. 592-596. doi: https://doi.org/10.1190/segam2021-3583769.1
Blackmon, D., 2023, November 23. A Familiar Name Is The Next Big Thing In The Permian Shale Bonanza. Forbes. https://www.forbes.com/sites/davidblackmon/2023/11/28/a-familiar-name-is-the-next- big-thing-in-the-permian-shale-bonanza/?sh=7848e6b19c1f. (February, 2024).
Comer, J. B., 1991. Stratigraphic Analysis of the Upper Devonian Woodford Formation, Permian Basin, West Texas and Southeastern New Mexico. No. 201. Bureau of Economic Geology, University of Texas at Austin.
Horak, R., L., 1985. Trans-Pecos tectonism and its effect on the Permian Basin. in Dickerson, P. W., and Muehlberger, W. R., eds., Structure and tectonics of Trans-Pecos Texas: West Texas Geological Society Field Conference Publication No. 85-81, pp. 81-87.
McEwen, M., 2023, January 20. Barnett Shale targeted as Permian operators move into new plays. Midland Reporter-Telegram. https://www.mrt.com/business/oil/article/Barnett-Shale-targeted-as- operators-move-into-new-17728093.php. (February, 2024).
Osterlund, C. H. 2012. The Barnett Shale (Mississippian) in the Central Midland Basin (Andrews, Ector, Martin, and Midland counties). Texas Christian University, Department of Geology.
Wright, W. R., 2006. Depositional History of the Atokan Succession (Lower Pennsylvanian) in the Permian Basin. Bureau of Economic Geology, University of Texas at Austin.
Post Date
Jun 19, 2024Post Category
Case Studies