Imaging Delaware Fill Zone with Ultra High-Density Data and High-frequency Land FWI
Summary
The advanced imaging flow including 40 Hz FWI in conjunction with an industry-support ultra high-density survey provided a high-resolution velocity model and full waveform inversion (FWI) seismic image to resolve the complex near-surface geology in the Delaware Fill Zone. This more accurate near-surface model improved image in the deep reservoir level.
Introduction
The Delaware basin has traditionally been challenging to image due to complex near-surface geology known as a combination of slow Fill zone and fast layers. The Fill is widely spread throughout the Delaware basin and caused by the dissolution of salt from the Salado formation. Upon dissolution, the Rustler formation sitting above the Salado collapses and is filled by Cenozoic sedimentary deposits (Anderson, 1981). The much slower and strong heterogeneity Fill acts as a high attenuation and scattering zone for seismic waves travelling through. Beneath the Rustler, interbedded halite and anhydrite in the Salado and Castille formations introduces spatial-varying fast layers and sharp velocity contrasts, which trap seismic energy and generates strong surface wave noise. In addition, the rapidly changing velocities and complex structures at near surface causes structural distortions at the reservoir level.
In the past, land FWI has been successfully applied in the Delaware basin to resolve the interbedded halite and anhydrite layers, leading to simplified deep structure and revealing shallow drilling hazard information (Bai et al., 2020). Utilizing land full waveform inversion to obtain high resolution models of the Cenozoic Fill, however, is challenging due to the sparse surface-seismic sampling of legacy surveys. Focusing on the image of shallow Fill and near-surface geology down to the Castille (~3000’ below surface), an industry-supported ultra high-density test survey was acquired in 2024 over a four-square mile area in the southeast Eddy Conty, New Mexico. The application of 40 Hz Time-Lag Full-Waveform Inversion (TLFWI) on the four-square mile test area reveals the complexity of the Fill and fine structures of the Rustler. The decimation test demonstrates dense sampling is important for imaging the Fill.
Ultra high-density test in the Delaware Basin
The four-square mile ultra high-density test survey is located at the southeast Eddy County, New Mexico (Figure 1a). Within test area, over 20,000 Stryde nodes were laid out following 247.5’ line spacing (W-E) and 20.625’ station interval. Vibrator trucks using a low-dwell broadband sweep from 2 to 84 Hz were shaking along N-S with 495’ line spacing and 41.25’ station interval (Figure 1b). The trace density is 256 times legacy surveys, which usually have 990’ line spacing and 165’ station interval for both shot and receiver sides.
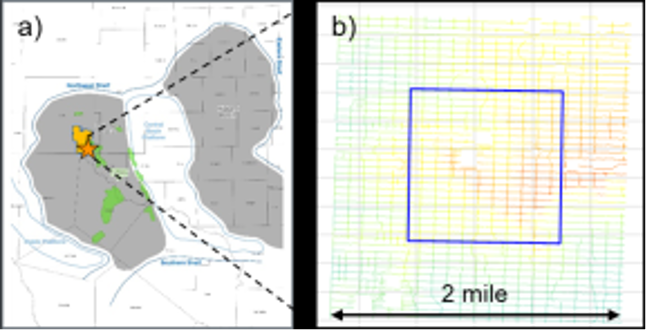
Because of size limitation, only the center one-square mile area, blue box in Figure 1b, has offsets beyond one mile, resulting in limited diving wave penetration depth and lack of full migration aperture support for deeper section. Therefore, the study focused on deriving more accurate velocity down to LMAR (Figure 4), the base of the thick interbedded fast layer.
Build starting model for FWI
A good starting model is important for successful seismic full waveform inversion application (Huang et al., 2021; Bai et al., 2021), especially when data constraints are insufficient for FWI such as missing ultra-low frequencies and ultra-long offsets. In our study, a dedicated model building flow which involves first-arrival tomography and interpolation of smoothed sonic trends was implemented to overcome the challenges from inadequate data support.
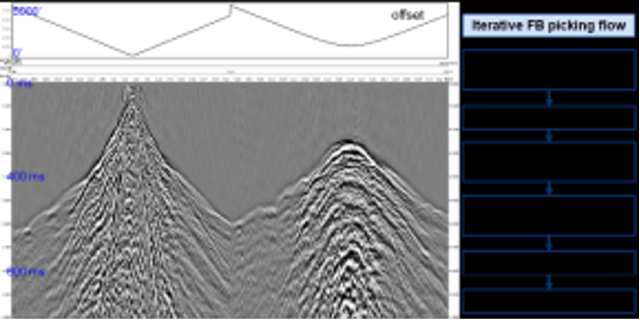
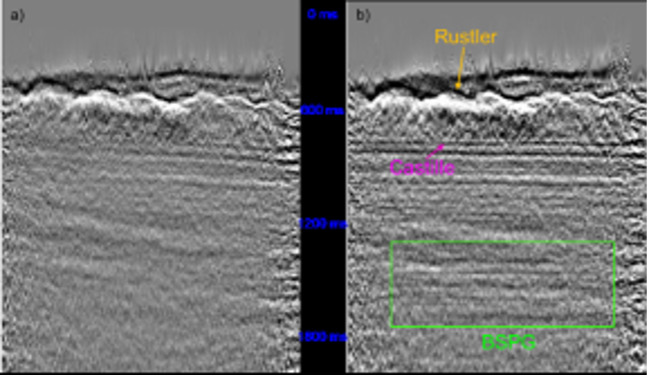
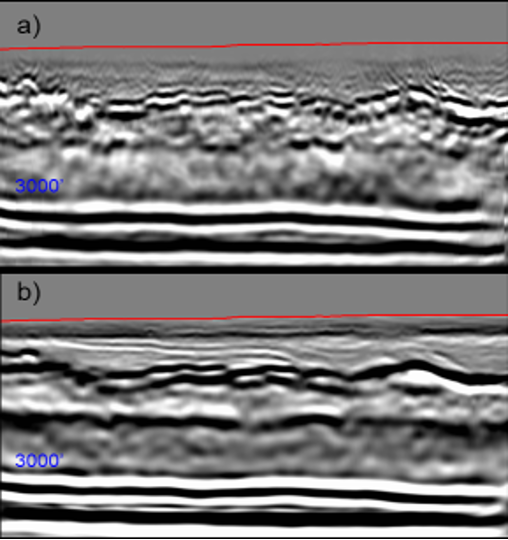
Frist-arrival tomography highly relays on first break (FB) picking quality. Azimuthal guided functions and iterative FB picking flow were utilized to address the FB heterogeneity (Figure 2) caused by rapid velocity change and structure at near surface in the Fill. Figure 3 shows the raw stack comparison with and without refraction statics derived from the first-arrival tomography model. After applying refraction statics, structure is simplified from the shallow to deep and target BSPG focusing is improved, indicating the derived shallow model captures the near-surface variations.
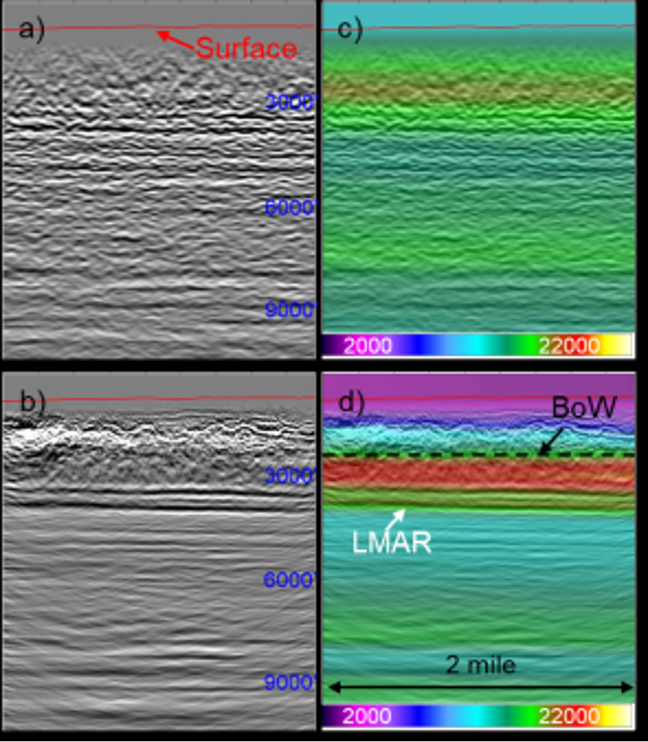
Due to short offset coverage and shallow fast layers, first-arrival tomography was only able to invert velocity above the fast layer, i.e., above the picked base of weathering (BoW) horizon (Figure 4d). Smoothed sonic trends were merged with refraction tomography model at BoW, and anisotropic parameters were derived from initial well tie at LMAR. This initial model has more details, and the corresponding KPSDM (Figure 4b) presents the Rustler structure while the legacy final KPSDM (Figure 4a) poorly images the shallow partially due to coarse data.
40 Hz FWI
The starting model already captures the near-surface long-wavelength velocity trend but is not able to resolve the fine details due to limited resolution of ray-based method. Thus, seismic full waveform inversion (FWI) was applied to resolve the fine-scale structures and obtain a high-resolution model.
The Cenozoic sediment velocity in the Fill ranges from 2500 ft/s to 6500 ft/s, requiring higher frequency FWI and dense seismic sampling. In our study, acoustic TLFWI was run from 5 Hz to 40 Hz which is the good SNR band to invert the velocity model above LMAR using both refraction and reflection energies. A dedicated noise attenuation flow was applied to attenuate surface wave noise while preserving the super shallow near-offset refractions and reflections.
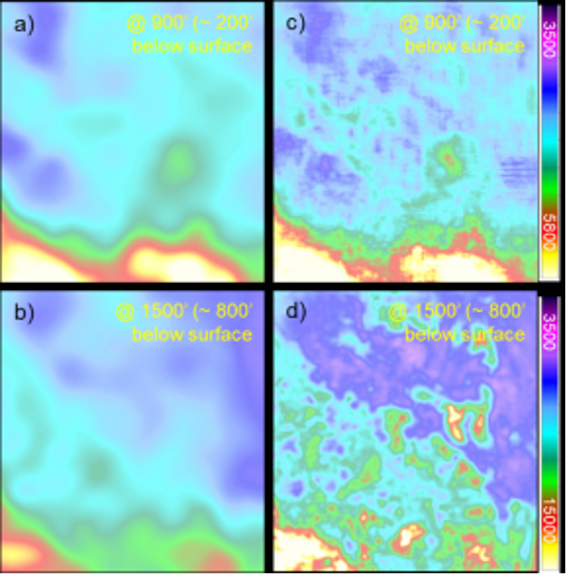
As shown in Figure 5, 40 Hz TLFWI resolved the fine-scale near-surface velocity anomalies in the fill and clearly delineated the Rustler and interbedded fast halite and anhydrite layers, leading to significantly improved image over FWI starting model even down to the deeper BSPG target level. Figure 6 shows 40 Hz FWI captured strong velocity variation inside the slow Fill zone (6a and 6c) and rapid velocity change associated with the Rustler structure (6b and 6d), which is important for shallow drilling hazard study. Because the sampling is suboptimal across shot and receiver lines, the imprint of acquisition footprints is observable at very shallow (Figure 6b).
Thanks to iterative least-square fitting and additional illumination from full wavefield (Zhang et al., 2020), FWI image, the derivative of the velocity model normal to the reflector dips, has improved SNR and near-surface structure over KPSDM. The sediments inside slow Fill above the Rustler and the top of the fast layer are better defined in full waveform inversion seismic image (Figure 7).
Impact of spatial sampling on FWI
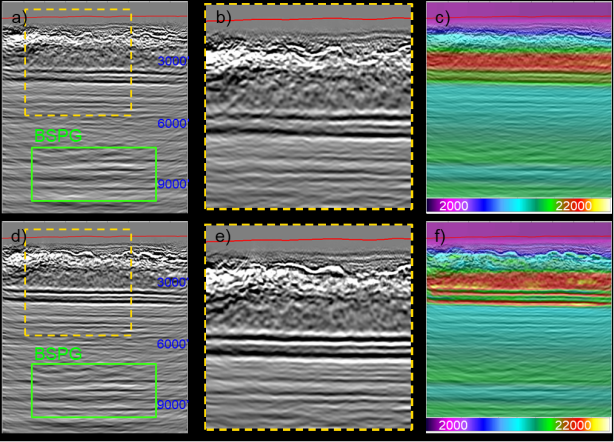
Dense acquisition is critical to image the complex slow Fill as demonstrated by the comparison between the test and legacy KPSDM (Figure 4). To further evaluate the impact of sampling on FWI, a decimation test was carried out. The FWI input was decimated to match the legacy acquisition station interval 165’ and line interval 990’, resulting in 256 times drop in fold. Then, the same 40 Hz FWI flow was run using the decimated input. Compared with FWI model using dense input data (Figure 8d), the 40 Hz FWI model using decimated model (Figure 8a) shows a much noisier update because of the larger shot/rec intervals and lower stacking power. This noisy model led to degraded FWI image (figure 8b and 8e) and reduced coherency in KPSDM (Figure 8c and 8f).
Discussions and conclusions
This study demonstrates high frequency TLFWI and dense sampled data are the keys to achieve high-resolution velocity model which leads to detailed migration image inside the shallow Fill zone. The accurate near-surface model subsequently improves the deeper target imaging. FWI image further delineates the Fill zone.
Acknowledgements
We extend our gratitude to Fairfield Geotechnologies for permission to public this work. Our sincere thanks go to the Viridien team who worked hard on the signal processing, and all the participated underwriters for fruitful discussions.

Anderson, R. Y. (1981). Deep-seated salt dissolution in the Delaware Basin, Texas and New Mexico. Environmental geology and hydrology in New Mexico: New Mexico Geological Society Special Publication, 10, 133-145.
Bai, D., Hou, F., & Hefti, J. (2020). A case study in the Delaware Basin: Application of Time-Lag FWI and 3D SRME/IMA multiple attenuation.
Bai, D., Zheng, L., & Deng, W. (2021, October). Imaging the complex geology in the Central Basin Platform with land FWI. In SEG International Exposition and Annual Meeting (p. D011S027R002). SEG.
Huang, R., Zhang, Z., Wu, Z., Wei, Z., Mei, J., & Wang, P. (2021). Full-waveform inversion for full-wavefield imaging: Decades in the making. The Leading Edge, 40(5), 324-334.
Zhang, Z., Wu, Z., Wei, Z., Mei, J., Huang, R., & Wang, P. (2020, October). FWI Imaging: Full-wavefield imaging through full-waveform inversion. In SEG International Exposition and Annual Meeting (p. D031S027R004). SEG.
Post Date
Jul 17, 2025Post Category
Case Studies
Author
Lin Zheng*, Fengfeng Hou, Shuang Sun (Viridien) Andrew Lewis, Bruce Karr, Stephen Klug (Fairfield Geotechnologies)