Characterizing the Karst Features of the Rustler Formation and the Ochoan Evaporites in Southeast Eddy County, New Mexico
Taylor MacKay*¹, Andrew Lewis¹, Alfredo Fernandez² 1. Fairfield Geotechnologies, 2. Eliis Inc.
Copyright 2026, Unconventional Resources Technology Conference (URTeC) DOI 10.15530/urtec-2026-4491502
This paper was prepared for presentation at the Unconventional Resources Technology Conference held in Houston, Texas, USA, 22-24 June
2026.
The URTeC Technical Program Committee accepted this presentation on the basis of information contained in an abstract submitted by the
author(s). The contents of this paper have not been reviewed by URTeC and URTeC does not warrant the accuracy, reliability, or timeliness of
any information herein. All information is the responsibility of and is subject to corrections by the author(s). Any person or entity that relies on
any information obtained from this paper does so at their own risk. The information herein does not necessarily reflect any position of URTeC.
Any reproduction, distribution, or storage of any part of this paper by anyone other than the author without the written consent of URTeC is
prohibited.
Abstract
This study aims to interpret shallow horizons related to Ochoan-aged evaporites and the overlying Rustler formation, and to characterize their associated karst systems in Eddy County, NM. Legacy seismic data over the same area was too sparse to image the Rustler previously. Understanding the geometry and extent of these dissolution features is important, as the associated velocity variations directly influence depth control and structural positioning of deeper producing formations. Improved definition of these shallow strata supports safer drilling, reduces uncertainty in target depths, and enables optimal well placement in the highly productive Bone Spring and Wolfcamp formations. A 2024-2025 high trace density (HTD) seismic survey was processed through Kirchhoff pre-stack depth migration (KPSDM). The KPSDM took advantage of a high-resolution velocity model derived from time-lag full-waveform inversion (TLFWI) up to 17 Hz, for a robust depth image. This dataset was used to construct a Relative Geological Time (RGT) model and generate 150 correlated horizons from the surface to the top of the Bone Spring formation. The combination of HTD seismic data with the RGT workflow, and multi-attribute visualization, provides an efficient approach to resolve complex shallow collapsed features. Karst-related geobodies were extracted using a multi-attribute K-means classification, integrating RGT shape index and seismic amplitude. In the study area, localized karst features occur across several shallow intervals, with major development in the Salado and Castile formations. Areas of intense Salado dissolution cause the Rustler formation to collapse and result in significant post-Permian sedimentary fill. This causes strong near-surface velocity variations resulting in imaging distortions. The RGT horizons constrain the relative geological timing of these collapsed features and enable more accurate geobody delineation. The HTD seismic survey illuminates detailed karst geometry constraining localized fill zone extents and improving resolution at the reservoir level. The combination of HTD seismic data and the RGT workflow enables the interpretation of some karst features at shallow depths previously unseen. Shallow karst features present drilling hazards which need to be avoided. Furthermore, this shallow structural complexity creates a major challenge to properly image the underlying producing reservoir formations. This study demonstrates that the combination of HTD seismic acquisition, TLFWI velocity modeling, RGT interpretation, and detailed multi-attribute analysis can accurately characterize these features. Additionally, this workflow provides a transferable methodology for understanding near-surface complexity in other karst-affected basins.
Introduction
Shallow karsting in Eddy County, NM has challenged geologists and geophysicists since the discovery of oil and gas in the region. As Maley and Huffington noted, “In addition to satisfying academic curiosity, a knowledge of the extent, thickness, and nature of fill in the Delaware Basin is of economic importance, inasmuch as the blanket of fill either prohibits or greatly restricts the use of surface geologic mapping and seismic prospecting in the constant search for new petroleum reserves” (Maley & Huffington, 1953). The fill is thought to be associated with the dissolution of salt primarily from the Salado and secondarily from the Castile formations. The dissolution of salt and subsequent stacking of anhydrite beds that were previously separated by salt makes log correlation and shallow subsurface interpretation difficult (Anderson, 1981). The fill is apparent on legacy seismic data; amplitude and bandwidth are noticeably changed in areas overlain by the fill. The frequency content is significantly impacted on the high end of the spectrum with thinner bed reflectors disappearing entirely. The spatial velocity variations directly impact depth control and structural positioning of deeper reservoir formations. Lime sand and limestone pebble fanglomerates appear to be deposited on an erosional and karst topography (Bachman, 1976).
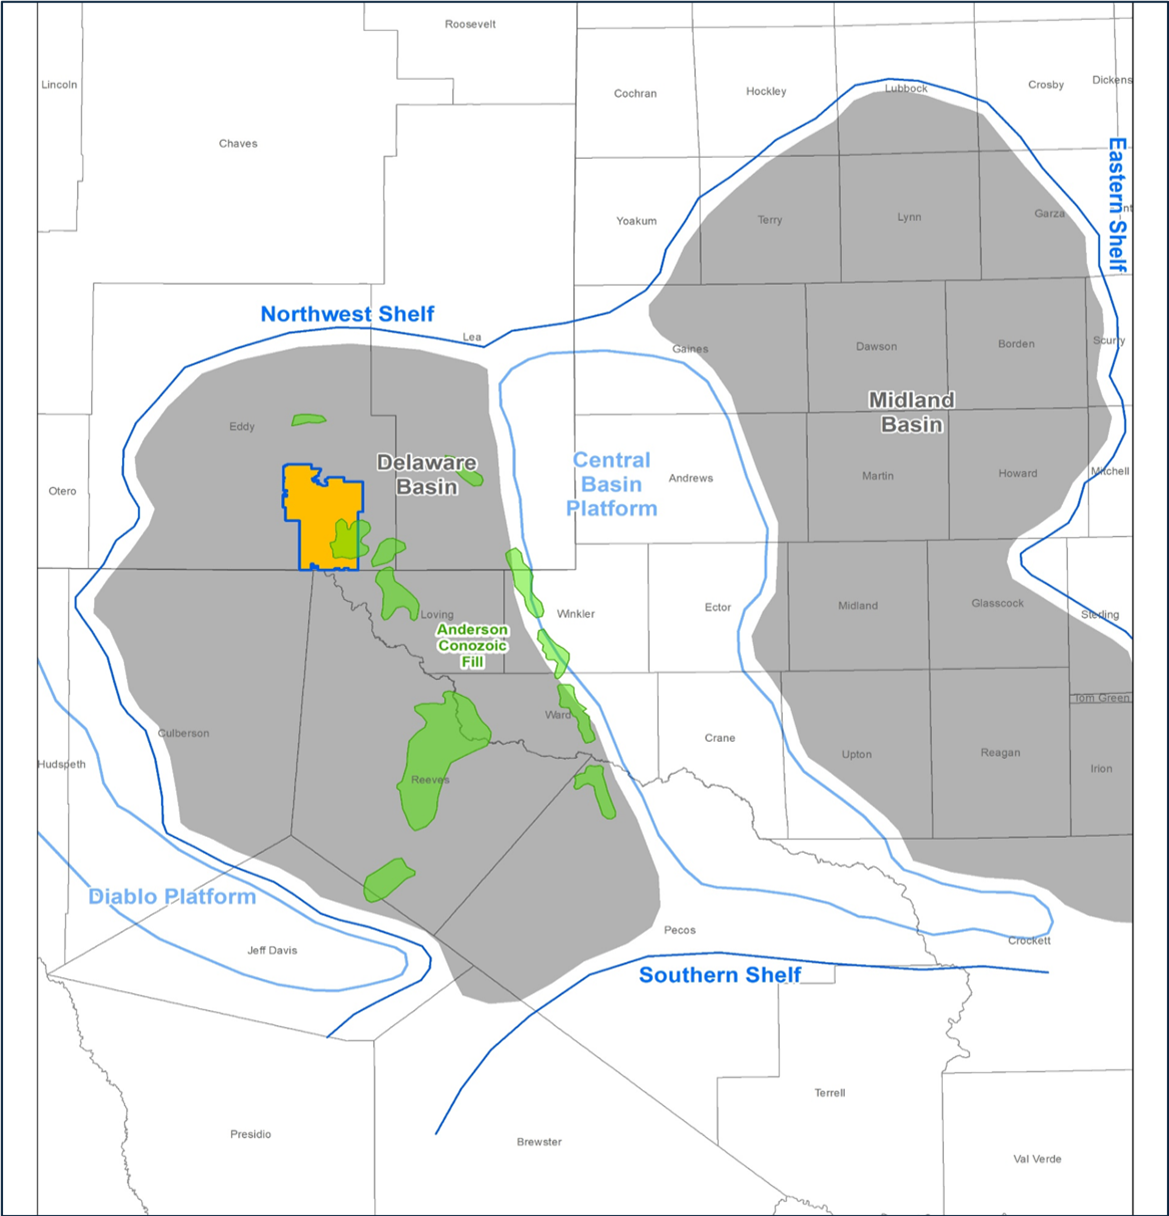
These form lenticular beds of conglomerate fill channel-shaped depressions as well as fill sinks, and at places these beds appear at the surface. The karsting is thought to be caused by ground water connecting to the Salado and Castile formations. This study aims to interpret the Rustler formation as well as to delineate karsting within the Salado and Castile formations both inside and outside the fill within the study area (Figure 1).
Data and Methods
A modern HTD 3D seismic survey was acquired with 495 foot source and receiver line spacings, with respective 41.25 foot source and 82.5 foot receiver station spacings. The survey has 33.5 million traces per sq. mi. on a nominal basis. Notably, the HTD survey provides 156 fold within the first mile of source-receiver offsets. This is a 4x increase when compared to the legacy data set. It was acquired in 2024-2025 and processed through KPSDM, using a 17 Hz velocity model derived using TLFWI (Bai, 2021). The processing flow was QI compliant, including surface-consistent corrections, noise attenuation, demultiple, and 5D interpolation.
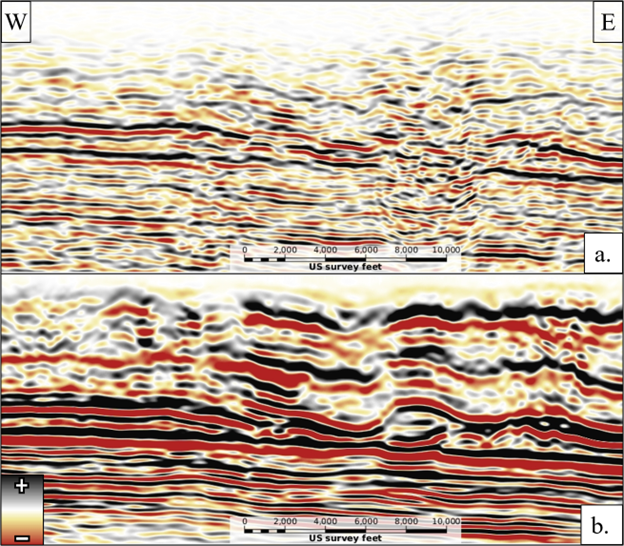
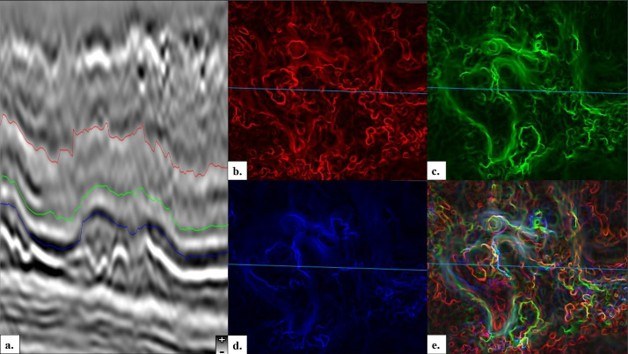
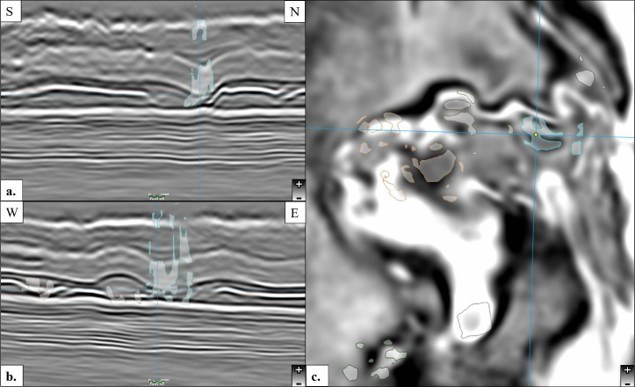
The legacy dataset spectrum, acquired with a linear sweep, is narrower than that of the HTD data, which used a custom nonlinear sweep that stays below 10 Hz for the first five seconds. There is a clear difference in the shallow image when comparing the two stacked datasets as seen in Figure 2. The legacy seismic data did not have the near-offset information collected that is required to image the slow velocity associated with the shallow fill zone (Figure 2). Following detailed processing and imaging of the near-surface, the HTD dataset was used to construct an RGT model. The model grid was picked using peaks and troughs with key horizons edited for accuracy in the complex shallow section. A horizon stack of 100 horizons was generated from surface to the Lamar encompassing the fill, Rustler, Salado, and Castile formations. This horizon stack was used over the full dataset, taking three individual horizons mapping the dip attribute of each and RGB blending the result to find areas of interest as seen in Figure 3. In these areas of interest, the RGT model was decimated due to the high sensitivity of the shape index attribute. Without this decimation an excessive number of disconnected geobodies would have been created due to the high trace density of the seismic survey. Decimation was tested to find the sweet spot for correlation with seismic amplitudes for geobody definition, and a decimation where every fourth inline and crossline for the RGT model was decided. Shape index was cross-plotted against itself using k means to create five distinct classifications. This was output between the bounds of the horizon stack to create the geobodies with classifications relating to valley, bowl, flat, ridge, and dome respectively. Valley was then isolated as the output corresponding to karsting. The generated geobodies were then sifted through and correlated to amplitudes in inline, crossline, and depth-slice views delineating all geobodies generated to the final ones of interest. This flow can then be iterated on other areas of interest within the seismic survey area.
Results
The Rustler horizon is very chaotic inside the fill due to the karsting present in the Castile and Salado formations. Even outside the fill complex areas can be observed. Despite these challenges, the HTD seismic image enabled interpretation of the Rustler across the whole survey. Enough near-offset data was collected for imaging to succeed with the near-surface geology. The geobodies after being manually filtered conform well to amplitude anomalies visible in depth slices as seen in Figure 4. The size of the karsting observed is highly variable, ranging from roughly 100 feet to 1800 feet in width. The geobodies also show complexity vertically; the tallest extend 2500 feet while the shortest measure 300 feet. Within the fill, karsting is sporadic, varying from concentrated karsting regions, to areas having minimal karsts. Outside the fill karsting still exist but is not as predominant. Some geobodies appear to continue almost to the surface; this could be possible, but the results could be affected by noise. Overall the shape and extent of the karst features are believable and encouraging. The fine detail and high correlation to amplitudes is impressive when comparing back to legacy data in which there was no image at this depth.
Conclusions
Modern HTD seismic acquisition, advanced processing, and new interpretation workflows together reveal subsurface geology that was previously unimaged. The Rustler formation in the fill zone, previously missing from seismic data, can now be imaged and interpreted, illuminating shallow karst features only seen before by the drill bit. This near-surface variability has direct implications for drilling design and must be accounted for in field development planning. Delineating the spatial distribution of karst features enables operators to avoid problematic intervals and reduce the likelihood of drilling-related incidents.
Faulting in the shallow section is of high interest for saltwater disposal. The possibility of faulting connecting formations disposal is occurring in needs to be carefully examined. If the formations are connected, new karsting could occur with the migration of fluid. Future work would include integrating well data or drilling data to corroborate the extent of the geobodies. This workflow is applicable to more than the Permian basin and could be used elsewhere with similar geology.
References
Anderson, R. Y. (1981). Deep-Seated Salt Dissolution in the Delaware Basin, Texas and New Mexico. New Mexico Geologic Society, 133-145. doi:https://doi.org/10.1190/INT-2024-0063.1
Bachman, G. O. (1976). Cenozoic Deposits of Southeastern New Mexico and an Outline of the History of Evaporite Dissolution. U.S. Geological Survey, 135-149.
Bai, D. (2021). Imaging the complex geology in the Central Basin Platform with land FWI. SEG Technical Program Expanded Abstracts (pp. 592-596). Denver: SEG. doi:https://doi.org/10.1190/segam2021-3583769.1
Maley, V., & Huffington, R. M. (1953). Cenozoic Fill and Evaporite Solution in the Delaware Basin, Texas and New Mexico. Bulletin of the Geologic Society of America, 539-546. doi:https://doi.org/10.1130/0016-7606(1953)64[539:CFAESI]2.0.CO;2
Post Date
Jun 24, 2026Post Category
Technical Papers
Case Studies